Lead Scoring (2026): Calculate the Points, Don't Guess Them


•
•
Lead scoring ranks leads by how likely they are to buy, using point values assigned to attributes and behaviours. The part almost nobody does properly is choosing those point values. In most models the numbers came out of a meeting, which means the score is an opinion wearing a number costume.
You can calculate them instead. Every attribute in your CRM already has a close rate attached to it, and the ratio between that close rate and your baseline tells you exactly what the attribute is worth. This guide covers the arithmetic, the sample size you need before the arithmetic means anything, and the back-test that tells you whether the finished model actually ranks.
Lead scoring assigns numeric values to a lead’s attributes and actions, then sums them into a score used to prioritise outreach. The academic literature splits scoring into two classes: traditional models, which rely on the experience and judgment of salespeople and marketers, and predictive models, which derive their weights from historical data using statistical methods.
That distinction is the whole problem. A systematic review of 44 lead scoring studies, published in Information Technology and Management, found that logistic regression and decision trees are the most commonly applied algorithms in predictive scoring. Both are doing the same underlying job: measuring how much each attribute moves the odds of conversion. There is nothing exotic about it, and you do not need a machine learning model to get most of the benefit.
What you need is to stop inventing the numbers. “Downloaded an ebook, plus 10” is a guess. “Downloaded an ebook, plus 0, because our ebook downloaders convert at exactly our baseline rate” is a measurement. The second one survives contact with a sceptical sales team.
The cost of getting it wrong is rep time, which is the scarcest input you have. Salesforce’s own research puts reps at 9% of the week researching prospects, 8% prospecting, and 8% prioritising leads and opportunities. A quarter of the week goes to deciding who to contact. A model that ranks badly does not save any of it.
Here is the arithmetic. It takes an afternoon with a CRM export and a spreadsheet.
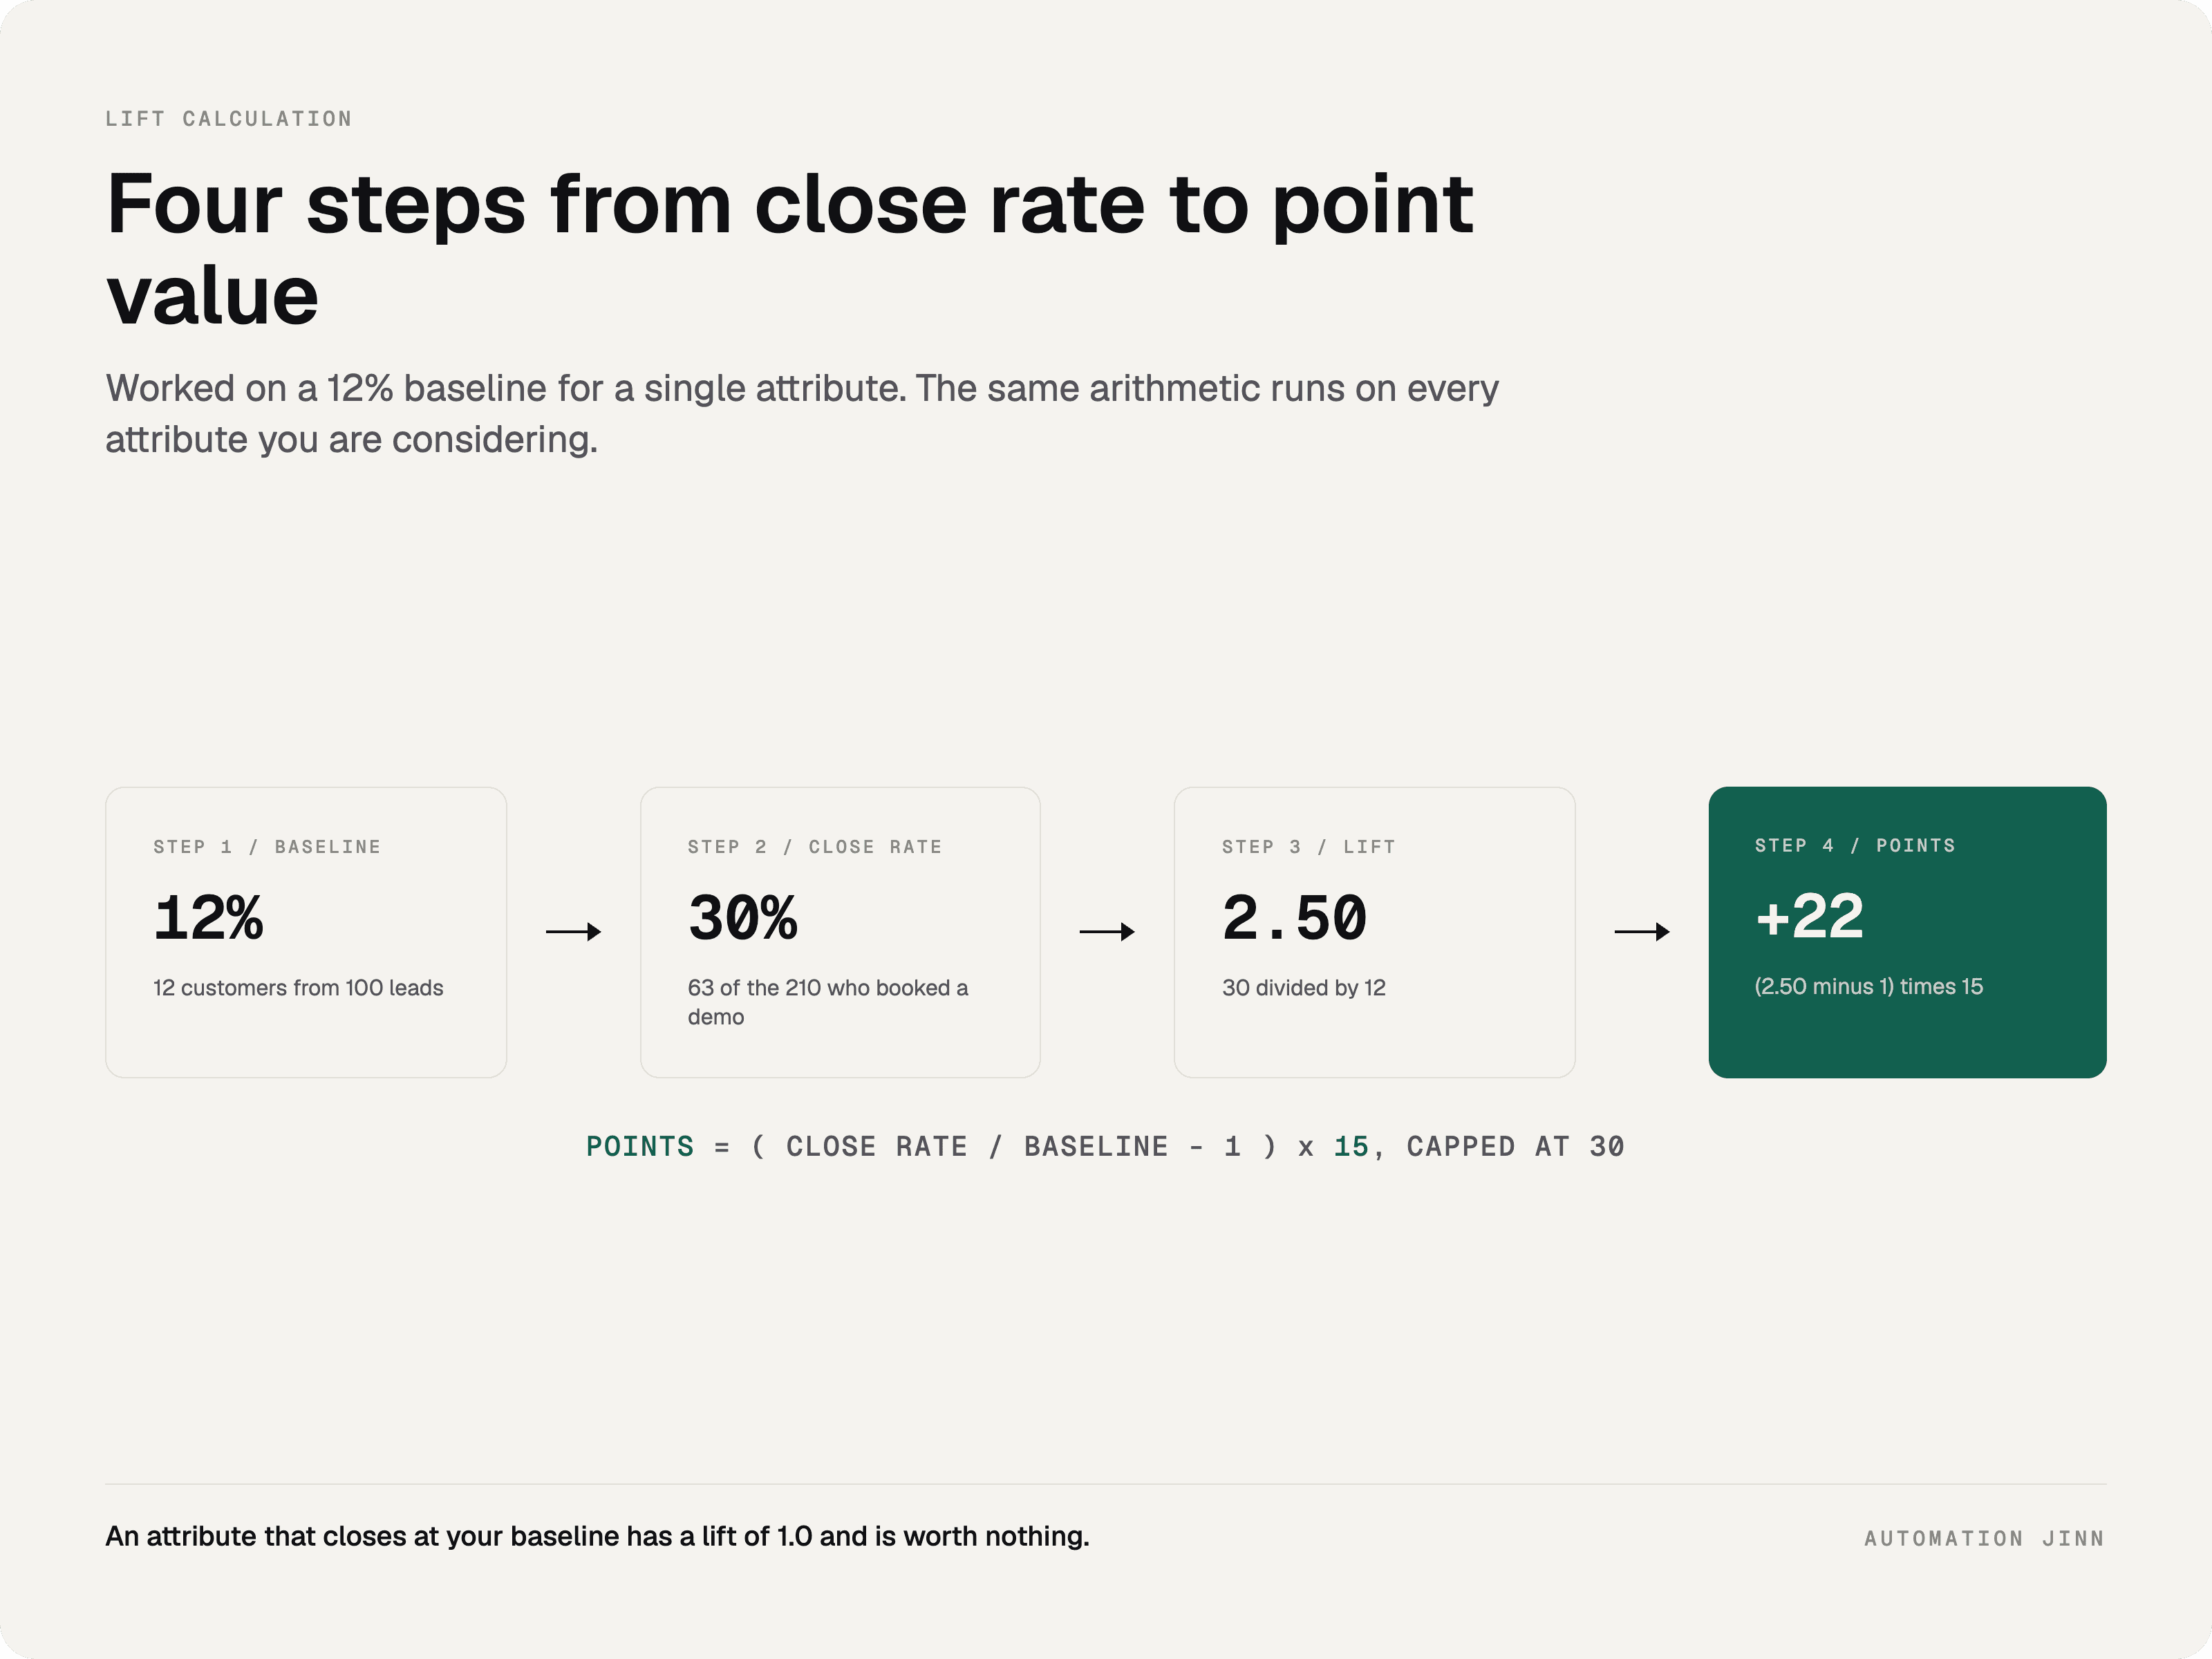
Step 1. Calculate your baseline conversion rate. Total leads that became customers, divided by total leads, over a period long enough to cover a full sales cycle. Say you closed 12 customers from 100 leads, so your baseline is 12%.
Step 2. Calculate the close rate for each attribute. For every attribute you are considering, take only the leads carrying it, and work out what share of those converted.
Step 3. Divide. Lift is the attribute’s close rate divided by your baseline. A lift of 2.0 means leads with that attribute convert at twice your normal rate. A lift of 1.0 means the attribute tells you nothing.
Step 4. Convert lift into points. Points = (lift − 1) × 15, rounded, capped at 30 per attribute. The 15 is a scaling constant. Pick it so your strongest attribute lands near your cap, then keep it fixed across every attribute so the relative weights stay honest.
Worked through on a baseline of 12%:
Attribute | Leads | Converted | Close rate | Lift | Points |
|---|---|---|---|---|---|
Booked a demo | 210 | 63 | 30.0% | 2.50 | +22 |
VP or above | 340 | 68 | 20.0% | 1.67 | +10 |
Headcount 50 to 500 | 520 | 104 | 20.0% | 1.67 | +10 |
Attended a webinar | 180 | 32 | 17.8% | 1.48 | +7 |
Downloaded an ebook | 610 | 73 | 12.0% | 1.00 | 0 |
Free email domain | 290 | 6 | 2.1% | 0.17 | exclude |
Two rows in that table are the interesting ones. The ebook scores zero, because its downloaders convert at precisely the baseline rate, which means the attribute carries no information even though it feels like engagement. Most hand-built models give an ebook download somewhere between 5 and 15 points on instinct. And the free email domain has a lift of 0.17, far enough below 1 that it belongs in an exclusion rule rather than a negative score.
Run this once and you will usually find two or three criteria in your existing model with a lift close to 1.0. Cutting them improves the model more than any new signal you could add, because every point awarded for a non-predictive attribute is noise competing with your real signals.
A close rate calculated on a small group is not a close rate, it is a rumour. This is the step that gets skipped, and it is why so many carefully built models rank no better than random.
The margin of error on a proportion shrinks with the square root of the sample, which is slower than people expect. At a 20% close rate:
Leads carrying the attribute | 95% margin of error |
|---|---|
25 | ±16 points |
50 | ±11 points |
100 | ±8 points |
250 | ±5 points |
500 | ±3.5 points |
At 25 leads, a measured close rate of 20% means the true rate is somewhere between 4% and 36%. You cannot build a weight on that. At 250 the range is 15% to 25%, which is tight enough to act on.
Three practical thresholds follow from this:
Under 30 leads carrying the attribute, do not score it. Leave it out entirely until you have volume.
Between 30 and 100, treat the weight as provisional. Score it, cap it low, and revisit next quarter.
Above 100, the weight is worth trusting until something structural changes.
This is also the honest answer to why small teams should not attempt an elaborate model. If you have 200 leads a quarter spread across fifteen attributes, almost none of those attributes will clear the bar. Score the three or four that do, and leave the rest.
The CRM vendors agree with the principle and disagree wildly on the number. HubSpot’s AI scoring will train on a minimum of 50 contacts, split 25 converted and 25 not. Salesforce is far stricter: Einstein Lead Scoring wants at least 1,000 leads created in the last 200 days, of which 120 converted, and until you reach that it scores you with a global model built from other customers’ anonymised data rather than your own.
That twentyfold gap between two serious vendors tells you the honest answer is “it depends on your conversion rate and how many attributes you are testing.” Salesforce’s threshold is the more conservative one, and if you are building the model by hand it is the better guide.
Most guides on this topic tell you to sum everything into a single score. The tool that ranks first on this search does the opposite, which is worth noticing.
HubSpot’s lead scoring documentation describes three score types: engagement scores, fit scores, and combined scores. Engagement scores rank on actions, fit scores rank on demographic and firmographic properties, and the combined type keeps all three values on the record rather than collapsing them. Its threshold labels run A1 through C3, where the letter is fit, A being high, and the number is engagement, 1 being high. A low-fit but highly engaged contact is a C1.
That labelling exists because a single number is ambiguous at exactly the moment a rep needs clarity. A 60 could be a perfect-fit company doing nothing, or a bad-fit company doing everything. Those two leads need opposite treatment, and one number cannot tell them apart. We covered where to draw the boundary between those cases in the lead qualification guide; the point here is narrower, that the lift arithmetic should be run separately on each axis so a strong fit signal never quietly cancels a weak engagement one.
Practically: compute a fit lift table and an engagement lift table, keep them as two fields, and let your thresholds read both.
There is a case for a third axis, and it is worth knowing about even if you do not build it in version one. Timing signals sit outside your website entirely: a funding round in the last eighteen months, a hiring surge, a new VP in the function you sell to, a competitor’s contract coming up for renewal. A perfect-fit account with strong engagement might still be six months from a decision, while the same account three weeks after it raised a Series B and hired a new head of revenue is a different proposition. Trigger signals decay faster than anything else in the model, so if you add them, give them a short window and a hard expiry.
Fit and engagement tell you who is likely to buy. Neither tells you how much they are worth, and a model that ranks a $20,000 opportunity and a $200,000 opportunity identically is not doing the one job an account executive needs from it.
For seat-based pricing the estimate is arithmetic you already have:
Estimated ACV = target team size × monthly price × 12
Then apply multipliers for the signals that predict the team growing, an approach Maja Voje sets out well in her 2026 lead scoring guide: recent Series A or later, ×1.2. Hiring velocity above 50% year on year, ×1.15. Multiple office locations, ×1.1.
Worked through for a tool at $100 per user per month, landing in a 100-person go-to-market org that recently raised a Series B and is hiring quickly:
Step | Calculation | Value |
|---|---|---|
Base | 100 × $100 × 12 | $120,000 |
Recent Series B | × 1.2 | $144,000 |
Fast hiring | × 1.15 | $165,600 |
Put that number on the record. A rep looking at “$166K estimated” needs no further explanation of why this lead outranks the one above it, and no score out of 100 communicates the same thing. It also changes what marketing does, because a high-fit, high-intent, $20,000 lead and a high-fit, high-intent, $200,000 lead deserve different amounts of effort and usually get the same.
The estimate will be wrong in absolute terms and that is fine. It only has to be right in relative terms, which is a far lower bar and still more than most models manage.
Attributes with a lift below 1.0 need a decision, and the two options behave differently.
Negative points subtract from the score and can be outvoted. A lead with a free email address that also booked a demo may still clear your threshold. Sometimes that is correct.
Exclusion rules remove the lead regardless of anything else. Nothing outvotes them.
Use the lift to decide. An attribute with a lift between roughly 0.5 and 1.0 is a mild negative signal and belongs in negative points. An attribute with a lift near zero is not a signal, it is a disqualification, and dressing it up as minus 20 points invites the model to be argued with. The free email domain row above, at 0.17, is an exclusion.
One caveat worth checking before you rely on decay to solve stale signals: HubSpot applies score decay per event, on a 1, 3, 6, or 12-month interval, and it applies retroactively to historical events. That is useful, but it also means turning decay on can move every score in your database at once. Test on a sample first.
A scoring model is a ranking machine, so test whether it ranks. This takes an hour and almost nobody does it.
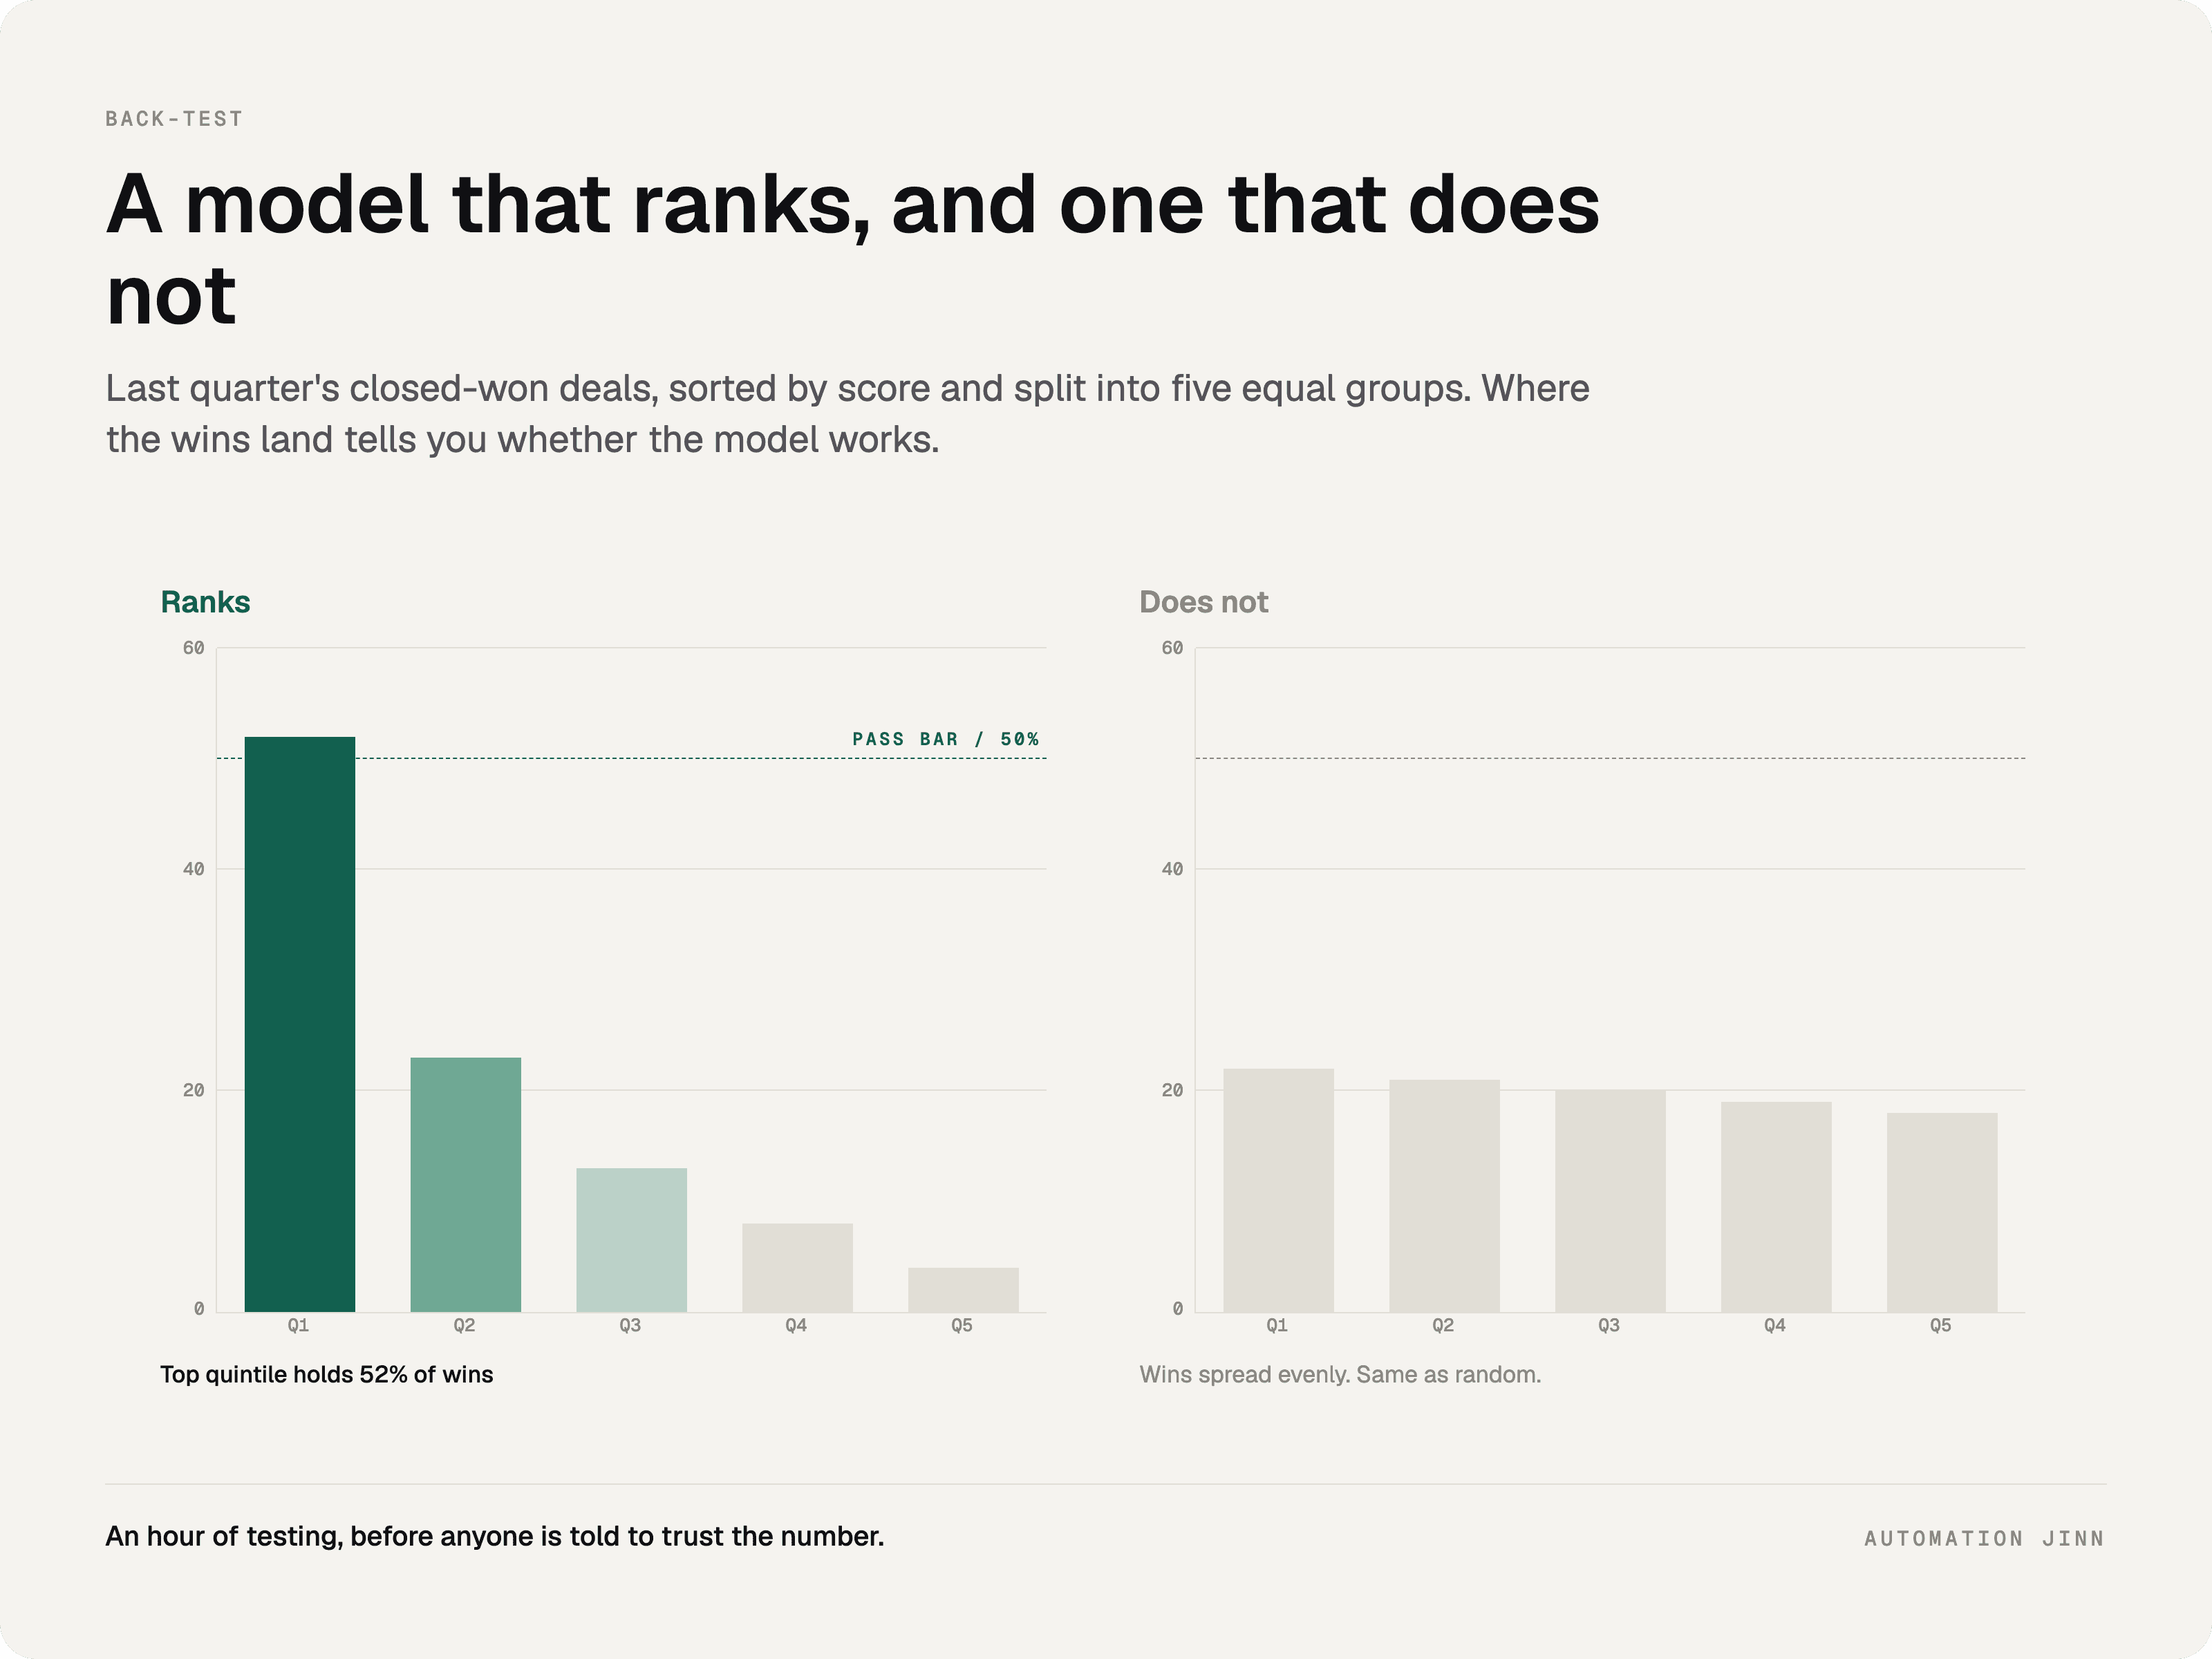
Take last quarter’s closed-won and closed-lost leads, score them all with the finished model, then sort by score and split into five equal groups.
The pass bar: the top 20% of scores should contain at least half of your closed-won deals. If your top quintile holds 50% or more of the wins, the model is ranking. If it holds 20%, the model is doing nothing that random ordering would not do, and the point values need rework before anyone acts on them.
Two follow-up checks are worth running at the same time. Look at where your closed-lost deals concentrate, since a good model pushes them down, not just wins up. And check how many closed-won deals fell below your MQL threshold, because every one of those is a deal your model would have told a rep to ignore.
Re-run the back-test quarterly, and immediately after any pricing, packaging, or ICP change. Weights derived from one ICP do not transfer to another, and a model that silently encodes last year’s target is worse than no model, because people trust it.
The arithmetic is portable. The implementation is not, and each of the three platforms most seed to Series B teams run has a specific constraint that catches people out.
Attio | HubSpot | Salesforce | |
|---|---|---|---|
Manual scoring | Workflows plus AI Attributes | Score groups with per-group caps | Formula fields or Flow |
Predictive option | AI Attributes against a written rubric | AI scoring, Marketing Hub Enterprise | Einstein Lead Scoring |
Plan gate | Workflows on every plan, Free included | Professional and above | Einstein tiers |
Watch out for | Workflow runs consume credits | Decay applies retroactively | Global model until you have volume |
Attio. This is where we build most of these, and the reason is the gate: Workflows are on every plan including Free, so scoring is not locked behind an upgrade the way it is elsewhere. Two features do real work for a lift-based model. AI Attributes fill a field by evaluating a record against a rubric you write in plain language, which is the closest thing available to encoding a lift table without building formula logic by hand. And the Research Agent pulls funding, hiring and news signals directly onto the record, which is what makes the timing layer above practical without buying a separate enrichment tool. One cost to model in advance, workflow runs consume workspace credits, so a scoring workflow firing on every attribute change carries a running bill worth sizing before you build it. For a sense of the return, Attio’s customer Granola story reports lead triage going from two hours to twenty minutes a day. Getting the data model and the workflow logic right up front is the bulk of our Attio implementation work.
HubSpot. The feature that matters most here is score groups with their own caps. Put awareness events in one group capped at 20 and conversion events in another capped at 60, and page views can no longer outvote a demo request no matter how many of them pile up. That is the single most useful guardrail in the product and most setups never use it. Two things to plan around: score decay runs at 1, 3, 6, or 12-month intervals and applies retroactively to historical events, so switching it on moves every score in the database at once. And the Contains any of operator is additive for engagement criteria but not for fit criteria, which means the same operator does different arithmetic depending on which score it sits in. Use the preview and test-records tools before turning anything on.
Salesforce. Manual scoring lives in formula fields or a Flow, which is unglamorous and works. Einstein is the predictive route, and its data requirements are the ones quoted earlier. The consequence worth thinking through is the global model: below the threshold, Einstein scores your leads using patterns from other companies’ data, which may or may not resemble your buyers. It is a reasonable default and a poor substitute for a lift table built on your own closed-won deals.
Whichever you are on, the blocker is almost never the platform. It is that the attributes you want to score on live in four systems and disagree with each other, so headcount is a picklist in one place and free text in another, and no single field answers “is this account in our ICP.” Consolidating that into computed fields, then deriving the weights against real outcomes, is the unglamorous middle of RevOps and GTM systems work, and it happens inside the CRM you already run.
Three habits keep the model alive after launch. Store the lift table itself somewhere versioned, not just the resulting point values, so the next person can see why an attribute is worth 10 rather than 25. Keep fit, engagement and predicted value as separate fields so the layering survives contact with a well-meaning admin. And put the back-test in the calendar rather than intending to do it, because a model nobody re-tests drifts quietly, and the first sign of trouble is usually a rep who stopped looking at the score months ago.
A score also has to lead somewhere. Once a lead clears your threshold, the rules deciding which rep picks it up are a separate system with their own failure modes, and a model that ranks perfectly into a queue nobody watches has not saved anyone any time.
Two situations where the arithmetic cannot work yet. Fewer than roughly 200 leads a quarter and you will not clear the sample-size bar on enough attributes to build anything trustworthy. A sales cycle longer than your clean CRM history and you have about one cycle of outcomes to learn from, which makes every weight unstable. In both cases write down the exclusion rules, which stay valid at any volume, score on fit alone, and wait. These are volume problems rather than method problems and they resolve on their own.
At the other end, the lift method is a manual approximation of what a regression does, and it treats every attribute as independent. In reality they interact: a VP title might matter enormously at 200-person companies and not at all at 20-person ones. A regression catches that and a spreadsheet does not, which is the real argument for moving to predictive scoring once you have the volume for it.
Keep the lift table either way. It is what you show a sceptical rep who asks why a lead scored what it scored, and explainability is most of what earns a model its adoption. A model nobody can interrogate gets quietly ignored, whatever its accuracy.
Lead score is calculated by assigning point values to a lead’s attributes and behaviours, then summing them. The reliable way to choose those point values is lift: divide each attribute’s close rate by your overall conversion rate, then scale that ratio into points. Attributes with a lift near 1.0 should score zero.
The process is five steps: calculate your baseline conversion rate, calculate the close rate for each candidate attribute, divide to get lift, convert lift into points, then back-test the finished model against last quarter’s closed deals. Attributes with fewer than 30 supporting leads should be left out entirely.
On a 12% baseline, leads who booked a demo closing at 30% have a lift of 2.5 and earn 22 points. Leads who downloaded an ebook and closed at 12% have a lift of 1.0 and earn zero. A free email domain closing at 2.1% is an exclusion rule rather than a negative score.
Grading usually refers to fit, expressed as a letter, while scoring usually refers to engagement, expressed as a number. HubSpot combines them into labels like A1 or C3, where the letter is fit and the number is engagement. Keeping the two separate is more useful than merging them into one value.
At least 30 leads carrying an attribute before you score it at all, and 100 or more before the weight is worth trusting. At 25 leads a measured 20% close rate could truly be anywhere from 4% to 36%. Below roughly 200 leads a quarter, use exclusion rules instead of a points model.
The one you already run. Attio puts Workflows on every plan including Free and can fill scoring fields from a written rubric, HubSpot gives you score groups with per-group caps, and Salesforce offers Einstein once you clear 1,000 leads and 120 conversions. The platform matters far less than whether your data model can answer “is this account in our ICP” from a single field.
Sparsh Gupta, Founder of Automation Jinn, helps B2B SaaS teams build GTM systems that score, route, and follow up without anyone babysitting them. If you want your point values derived from your own conversion data and back-tested before they go live, book a discovery call.